


A few months ago, Marc Bellemare noted that in at least some randomized control trials (RCTs), the treatment effect does not explain a whole lot of variation in the dependent variable (as measured by the R-sqaured). With this post, I want to make a subtle point: an RCT is not actually designed explain the variance of an outcome of interest, and in fact the treatment effect will never explain much of the variation in an outcome of interest. Consequently, we should either ignore it in presentations or just leave it out entirely.
To explain, recall that the R-squared is defined as the ratio of the variation that right-hand side variables explain in a regression to the total amount of variation in that variable. In an RCT, the goal is to understand either the average treatment effect on the treated (ATT) or the “intent to treat” effect, depending upon whether the researchers expect the treatment or intervention to be taken up by all potential beneficiaries or just a portion of them. This goal is very different from trying to explain variation in the outcome of interest, as either quantity is simply the difference in means between the treatment and the control groups. There is no reason to expect that controlling for that difference in means in a regression would explain variance in the dependent variable. The goal of estimating the ATT is therefore not to explain variation in the outcome, but rather to understand how much the outcome changes on average based on an intervention relative to the intervention not occurring.
To illustrate, I conducted a simple Monte Carlo experiment (Stata code here). I first constructed a hypothetical experiment in which the average treatment effect on the treated was 0.1 standard deviations, on a standard normal dependent variable. A power calculation suggested 3,200 observations would be necessary to identify the average treatment effect 80 percent of the time, so I generated 10,000 samples of 3200 observations with an average treatment effect of 0.1 (the treatment effect was generated with a mean of 0.1 and a standard deviation of 0.2). I plot the variance explained by the treatment effect in Figure 1 (see right hand sidebar). As expected, the treatment effect almost always explains less than half a percent of the variation in the dependent variable; otherwise, it performs quite well− the average estimated average treatment effect on the treated is 0.099, and it is significant at the 5 percent level 79.4 percent of the time in the Monte Carlo.
In theory, adding covariates to a regression of the outcome of interest on the treatment effect will not change the estimated average treatment effect because the covariates are orthogonal to the treatment indicator. It will, however, explain some of the variance in the outcome, reducing the overall variance of the regression and the standard error on the treatment effect. Since those covariates are thought to be related to the outcome, they should increase the amount of explained variance in the regression but not otherwise affect the treatment effect. In fact, they should explain much more of the variation in the dependent variable than the treatment effect.
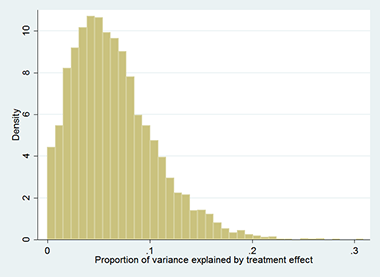
To illustrate, I added a randomly generated covariate with a correlation of 0.2 with the dependent variable in a second Monte Carlo experiment. I regressed the outcome on the treatment variable and the covariate, and measured the proportion of explained variance accounted for by the treatment variable in each experiment. The distribution of the proportion of explained variation in the dependent variable due to the treatment dummy is in Figure 2; it is typically less than 10 percent of explained variance. Otherwise, the estimates work just as expected: the average estimated average treatment effect on the treated is still 0.1, with a slightly lower standard error than in the first experiment, and the treatment effect is statistically significant in more cases− 81.4 percent of the time.
In conclusion, the variation in the outcome explained by the treatment effect is low by design. In an RCT, the treatment effect is meant to measure the difference in means between groups rather than explaining variation in the dependent variable. Not surprisingly, when a variable correlated with the outcome is included in the regression along with the treatment indicator in the Monte Carlo, it accounts for most of the explained variance. Clearly, policy makers worried about improving average outcomes should worry about the impact on the average outcome rather than the R-squared.